Written By: William H. Stroman, Laboratory Projects Analyst, San Diego Gas & Electric, 1995
Presented at: Applied Membranes, Inc. Seminar: Design, Operation & Maintenance of Reverse Osmosis Systems by Dr. Gil Dhawan.
Experience to Date in Troubleshooting Problems Encountered with the Encina Power Plant Reverse Osmosis System
This publication is for reference only and is not to be quoted, reproduced, or distributed without the advance written permission of San Diego Gas and Electric (SDG&E). SDG&E: 1) makes no warranty, express or implied, with respect to the accuracy or use of any information contained in this publication, and 2) disclaims any and all liability with respect to the use of, or damages resulting from the use of, any such information.Abstract
A shift in the early 1980's from base load to cycling operations of the generating units increased the demand for boiler water makeup. Due to the loss in production with unit evaporators during low load operation or those evaporators being out of service when the generating units were off line for economics, the decision was made to install a reverse osmosis system (RO) in front of an existing plant demineralizer (DI). Due to budget constraints in the early 1980's the decision was made to have a contract with a vendor to build and sell RO product to supply the service run gallonage to 1.8 million gallons from 100,000 gallons and allowed for the removal of the existing evaporators on the other 4 units. After 4 years of a five year contract, the option to purchase the vendor operated system was exercised in Jun 1988. This paper discusses the experience to date, in troubleshooting the RO system, membrane scaling problems, and modifications to improve operation of SDG&E's Encina Power Plant reverse osmosis system since taking over operation responsibilities from the vendor.
Background
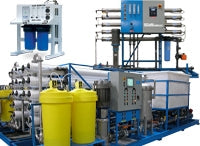
SDG&E has two RO system contracts that were built, operated, serviced, and maintained by the vendor to supply RO product feed supply to existing power plant demineralizers. Each contract had options at 4 years and 5 to purchase the RO system and end the service contract. Both RO systems were competitively bid with the main criteria requiring operation at 75% recovery and a minimum of 92% rejection of the feedwater constituents to specified gallonage e.g. Encina Power Plant 160 gpm and South Bay Power Plant 60 gpm. The Encina RO system consists of primary filtering, cartridge filtering, acid injection for pH control, high pressure pumps, vessels and cellulose acetate (CA) membranes aligned into a 4:3:2 array, degasifier and degasifier product pumps, reference figure 1. In the event the contract specifications couldn't be met, the vendor was required to bring in portable demineralizers.
At the end of four years, an evaluation determined it was economically beneficial for SDG&E to purchase the Encina Power Plant RO system and re-bid the service/maintenance contract. After purchasing the RO system, the intent was to bid our servicing and maintenance to a vendor. The original vendor lost the service/maintenance to a competitor. Two days prior to changing service vendors the high pressure pump failed which resulted in first pass membrane damage by debris from the failed pump. It took approximately 30 days to get the system back into acceptable production. Due to residual oil being burned in the boilers, additional water usage for fuel atomization was required. This further increased the RO/DI makeup requirements and with the RO system only able to produce ~90 gpm, portable demineralizers were brought in to help meet the water demand.
The new vendor was reluctant to accept the responsibility for service and maintenance of the RO system until the high pressure pump was repaired and the system was brought back within contract specifications. The RO system declined occurred, resulting in the feed pressure exceeding 500 psi caused leaks in the fiber glass wrap on two of the pressure vessels.
During the restoration period, the new vendor expressed concern with the system design, condition of the system equipment, and the high membrane fouling rate (NOTE: This information was made available during the bidding process). As a result, SDG&E replaced the RO membranes, overhauled the primary filters, replaced two leaking pressure vessels, installed a larger cartridge filter and added a chlorine injection system. A new short term contract was renegotiated and SDG&E ultimately took over maintenance and service of the RO system during 1989.
Membrane scaling from aluminum in the city water feed has been a chronic problem since the RO system originally went into service in 1984. Once the system was restored from the pump failure, efforts were then directed towards coping with the aluminum scaling problem. The solution for solving the problem was to lower the feed pH from the normal 5.7 to 4.8-5.0 range. At the 4.8-5.0 pH the solubility of the aluminum increases back to within the range of what it is in the feedwater.
The pump failure also pointed out many areas of concern with the RO system, with the main one being very little operating or system flexibility in the event of a problem with the RO system. For example the original system required two high pressure pumps to be in service in order to achieve design flow of 160 gpm. After taking over the operating and maintenance responsibilities in 1989, design modifications were formulated and in 1991 the original single system 4:3:2 array was separated into a two pass configuration, reference figure 2. The two pass configuration can be operated in parallel with a net 224 gpm or in series with a net of 120 gpm RO product. The series mode allows for the product of Train A to be the feed to Train B to produce less than 10 ppm degasified product for feed supply to the demineralizer.
Scope
Due to the poor performance of the RO unit and the problems with the service vendors, portable demineralizers were required to meet the plant makeup requirements. Because this was expensive ($50,000), plant engineering and laboratory personnel evaluated the RO system. The objective was to identify RO system component problems and what would be required to improve system operation, reliability and the taking over of service/maintenance by plant personnel.
Reverse Osmosis Unit Problem Solving
Discussions with several service companies, membrane manufacturers, contractors and other RO system users, yielded many different options for improving the system. To assist in the investigation, Process Scientific, Inc. (PSI) was contracted to evaluate the system and respond to a punch list of specific items compiled by SDG&E. After sorting through the various inputs received from PSI, vendors, manufacturers, and other RO system users, a corrective action plan was formulated.
The first decision was to determine who would operate and maintain the RO system, a vendor or plant personnel. The decision was to renegotiate the service contract and reduce the term of the contract to 15 months, then take over service and maintenance of the RO unit. The plan developed was to use the 15 month period to implement system improvements to make the system less maintenance intensive, build a chemical cleaning skid, put a normalization program in place, and train plant operations and maintenance personnel.
The second step was to evaluate RO performance. The investigation determined aluminum scaling coupled with the marginally designed RO system required significant manpower to maintain the unit within desired specifications, e.g. 160 gpm product flow @ 92% minimum rejection of the feedwater constituents.
Evaluation of the RO Components:
City Water Feed
Alum pretreatment chemical used by the Southern California Metropolitan Water District is the main contributor of the RO membrane scaling of the first pass elements. The aluminum scaling results in the loss of product flow and increases the RO feedwater pressure as required to maintain the desired product flow. If membranes are not chemically cleaned in a timely manner, the higher membrane pressure can lead to irreversible compaction of the membranes. Discussions regarding pretreatment with service companies, membrane manufacturers, contractors, and other RO system users yielded many different modes of corrective actions of which some are discussed in the following component evaluations.
Sand Filters
The sand filters (primary filtering) were not providing good pretreatment of the city water based on the silt density index (SDI) tests performed on the filter effluent. Before the filters were overhauled the SDI’s average 5.5. After the filters were overhauled the SDI’s varied between 4.5 to 5.6 (varies due to changes in seasonal water quality). Typically, an SDI of 5 indicates a high fouling rate, an SDI of 5 indicates moderate fouling, and an SDI of 3 indicates a fouling range that requires membrane cleaning once every 3 to 6 months.
Analyses of the micron filers used during the SDI testing found low organics (1%) and high aluminum (58%) and iron (42%) fouling. Samples of the feed water inlet and effluent of each filter was done to determine if internal corrosion was taking place. The analyses found that iron was in the feed water and not from the filters.
One of the recommendations made was to inject acid into the inlet of the sand filters to precipitate the aluminum out in the filter media. The precipitated aluminum is later removed during the backwash cycle. The sand filters were not removed during the filter backwash cycle. The sand filters were not designed for low pH (5.7) feedwater. The low pH environment would cause corrosion within the filters and iron fouling problems in the membrane from the corrosion byproducts.
To upgrade the filters to be more corrosion resistant would cost ~$75,000. An additional expense would also be incurred to modify the inlet piping to allow for the 10-30 second contact time after removal in the sand filters. Since this option was cost prohibitive, it was given a low priority on the corrective action punch list.
The filter manufacturer representative inspected the filters and recommended re-bedding with #30 sand in lieu of a blend of anthracite and sand during the overhaul. The sand media will filter down to smaller particle size than the anthracite/sand blend and proper bed expansion of the blend could not be achieved with the existing vessel height.
Cartridge Filters
The cartridge filter had a flow rating that would allow for a feedwater flow of 230 gpm. The 5 micron filters were fouling and reaching the change out pressure (delta 10 psig) within 1-7 days. This rate of fouling was also experienced by other RO users in this area. The cartridge filter was replaced with a larger one to increase the filter surface area. NOTE: After replacing the cartridge filter and lowering the feedwater pH to 4.8-5.0, the change out frequency now often exceeds 30 days.
Chlorine Injection
As part of the immediate corrective action plan, a chlorine injection system was installed to control the free chlorine residual between 0.05 to 0.1 ppm in the product. This helped to control biofouling in the membranes.
Methods for Controlling Aluminum Fouling
Several vendors recommended that the aluminum be dropped out of solution via pH adjustment of the feedwater prior to the sand filters to allow for its removal by the filtration process. As previously noted, the sand filters were not compatible with the lowered pH feedwater. Since it was not economically feasible to replace the original filters and modify the feedwater piping to produce the desired contact time, this option was placed low on the corrective action punch list.
Another recommendation made was to soften the city water and change out the RO cellulose acetate membranes to thin film membranes. This was not considered based on economics (e.g. capital $176,000), annual softener operating costs for the softener regenerations ($9,000), and the additional waste generated from the softener regenerations. NOTE: If this was a new plant design, pre-treating with water softeners can be a good option if the design utilizes the RO brine waste for other uses (e.g. cooling tower makeup, pump cooling) to reduce overall water requirements to minimize plant wastes.
The last option considered and implemented was to lower the feed water pH from the original control 5.7 pH to 4.8-5.0 pH downstream of the sand filters and before the cartridge filter. This matched the solubility of the aluminum with that of the incoming city water and prevented it from dropping out of solution on to the membranes.
The lowered pH control (4.8-5.0) also improves the membrane hydrolysis of the CA membranes which can help to increase the membrane life span. The 4.8-5.0 pH control does increase the monthly acid cost by approximately $35 but the benefits gained in cartridge filter replacement alone far exceed the increased cost of additional acid. Since the change was implemented, the interval between membrane cleanings has increased from 5 weeks to approximately 3-5 months. In addition, the cartridge filter elements change out frequency changed from once every 2-7 days to every 4 weeks, saving ~$500/month in consumables and labor.
The additional sulfuric acid added for lowering the feedwater pH from 5.7 to 4.8-5.0 also increases the amount of sulfate ions available towards the precipitation of barium, calcium, magnesium, and strontium sulfates. The RO unit performance projections by Fluid Systems indicate that only barium exceeds saturation in the RO brine @ 75% recovery. After the array was separated into a two pass system and the aluminum scaling problem was eliminated, we began to note problems with barium scaling in the second pass and is discussed in more detail later in the paper.
RO Membranes
The CA membranes were replaced in April 1989. The membrane replacement was done after completing items listed on the corrective action plan e.g. overhaul of the primary filters, installation of the chlorine injection, larger cartridge filter, lower feed pH (4.8-5.0), new pressure regulator and interstage pressure gages.
Pressure Gages
Pressure gages (total 2) were added at the effluent of the first vessel array (first inner stage pressure). In conjunction with the existing system feed and concentration pressure gages, the new gages allow for determination of which part of the system has the differential increase. Using the changes in differential pressure readings of the separate passes, the cleaning effort can then be directed to the specific pass that actually requires cleaning (e.g. clean only the first, second pass or third pass as required to maintain the system within desired operating specifications).
Performance Monitoring
System performance monitoring is done using the NORMPRO normalization software package provided by Fluid Systems. The purpose of the normalized data is to compare daily operating data to a standard set of operating conditions.
The normalization program is based on ASTM D-4516, Standard Practice for Standardizing Reverse Osmosis Performance Data. The membranes are now cleaned based on 10% maximum increase between current concentrate/feed differential pressure and baseline concentrate/feed differential pressure. This helps prevent excessive membrane fouling/scaling and irreversible membrane damage from occurring. (NOTE: Depending on the cause of scaling or fouling and how successful the cleaning is in restoring the system, a maximum of 15% can be used as the criterion for determining when to clean).
October 1991: The Original System was Changed into a Two-Pass Configuration
When the high pressure pump failed in 1988, it showed how important it is to have an RO system that is flexible and reliable when problems occur. Having one RO system with two high pressure pumps with each having less than 100% design capacity does not help provide overall system reliability and efficiency.
During October 1991 the existing 4:3:2 array RO system was separated into a two stage RO system with Train A having a 5:2 array and Train B a 4:2 array that can operate in series or parallel depending on system water requirements, reference figure 2. In parallel operations the combined output is 224 gpm with a degasified product quality less than 50 ppm, and in series, the combined effluent is 120 gpm with the degasified product quality less than 10 ppm.
The water quality from the series operation also increases the demineralizer gallonage throughout by an additional 2-3 times. NOTE: If the RO product storage tank has a floating roof or nitrogen cap to reduce the re-absorption rate of carbon dioxide, the DI anion exchanger gallonage throughout can be increased by as much as 20-40%.
The downstream unit (Train B) has not experienced any problems with fouling or scaling nor required a membrane cleaning since it started up in the two pass configuration (~3 years). The downstream unit should also have significantly longer membrane life span than the lead unit.
The array change also incorporated a post shut down city water flush (acidified and chlorinated) to purge the concentrated RO brine water from the membranes. The flush helps to prevent precipitation and organic growth during idle periods. NOTE: If possible, RO product should be used for the post shut down rinse to ensure thorough removal or dilution of the concentrated constituents that may be at or near saturation from the membrane brine feed channels. In addition, while the RO is in standby, there is potential for the RO product used in flushing to reach ionic balance with various minerals that may be present on the membrane surfaces that can be removed when the RO is returned to service.
Ongoing Efforts to Prevent Barium Scale Formation
Based on the NORMPRO normalization program, it was determined that the reverse osmosis (RO) Train A required membrane cleaning, reference figure 3. The Train A second pass was cleaned April 23 and the first pass was cleaned on April 24, 1992. This was the first cleaning since the RO was modified into a two train system in October 1991. The two step cleaning process using Flocon 103 A differential pressure across the second pass.
After the cleaning, the feed pressure was decreased and the differential pressure increased. This implied that the membrane surface was cleaned and that the brine feed channel was still plugged. On May 7, 1992 the last two elements of the second pass vessels were replaced (total of 4 elements). The element replacement reduced the pressure drop across the second pass back to when it was first separated into the two pass configuration.
The elements removed from the second pass had barium deposition present in the inlet of each element with the worst being the last element in series in each vessel. Two of the four elements removed from the second pass vessels were taken to Fluid Systems to be cut open for inspection. The #3 element of four had bands of deposits (later determined to be barium) along eth bottom section areas in the membrane, reference figure 4 and figure 5. The #4 element of four in series in the pressure vessel had bands of barium that were 4-6 times wider than #3 element and had more general deposits in the top sections of the membrane element, reference figure 6.
Based on the bands of barium noted being at the bottom or six o’clock position it appears that the barium in its supersaturated state is precipitating out of solution when changes in velocity occurs (i.e. unit shut down). After the initial precipitation occurs, it then becomes the seed for other particles to grow on and induces the formation of coagulated colloidal particles that increase the membrane fouling rate. The membrane scaling also increases the pressure drop across the membranes. After the initial precipitation occurs, a seed is formed for other particles to grow on that induces the formation of coagulated colloidal particles which increases the pressure drop across the membrane. As the fouling increases, the pressure drop across the elements also increases to the point what membrane cleaning is required to prevent damage to the membrane elements.
An evaluation was done on the post shutdown flush used to eliminate potential barium, calcium, magnesium, and strontium saturation when the RO system goes into standby. (NOTE: The flush water is maintained to the same ranges as the in service specifications, e.g. pH 4.8-5.0, chlorine 0.05-0.1 ppm). The evaluation found that even at city water pressure (regulated to ~60 psi) RO product was being produced @ 50% recovery and the flush water was not adequately removing the brine concentrate out of the membrane elements. The recommendation was made and implemented to bypass the brine control valve during the post shutdown flush. This modification reduced the product flow and increased the rinse flow rate without increasing the constituent concentration in the rinse water.
It appears that during the RO membrane cleaning, cross contamination of the first pass is occurring by the cleaning solution during the second pass cleaning. The contamination occurs when the cleaning solution enters the common brine header between the first and second passes. With the inlet feedwater valve closed to the first pass, the cleaning solution (estimated to be ~3 gpm) enters via the interstage header into the first pass and through the membranes. The 3 gpm flow through the membranes then concentrates the cleaning chemical, debris and dissolved constituents from the second pass clean onto the feedwater side of the first pass membranes. Any foulants that are in the solution (i.e. barium, calcium, strontium) from the second pass cleaning, enters the first pass resulting in some scale deposition onto the membranes.
Based on past cleaning experience, barium and strontium are normally not present in the first pass cleaning as was the case during the cleaning, reference figure 7, cleaning analyses. Due to the concentration of various elements taking place in the RO system, (i.e. product removal concentrating the feedwater into brine) the potential for barium, calcium, magnesium, and strontium to become saturated would normally take place in the second pass downstream elements and not in the first pass.
Prior to the conversion to the two pass RO system, the RO headers were disconnected and a cleaning header was installed. This allowed for 100% isolation between the pass being cleaned and the remaining RO pass not being cleaned.
When the RO system was upgraded, the industry method of cleaning uses the existing brine, feedwater and product headers during the cleaning. The rationale for the cleaning method, was that the pass not being cleaned would have very little or no flow due to feedwater valve being closed. However, most cleaning procedures do not monitor the post clean rinse after each cleaning step as thoroughly as our procedure, which uses DI water for rinsing and continuous conductivity measurements until it reaches 10 mmhos to note cross contamination.
In August 1993, isolation valves were installed on the Train A RO system to ensure 100% isolation of the first or second pass during membrane cleaning. In addition to eliminating cross contamination of the pass not being cleaned, the modification also reduced the time for the cleaning hook up, dismantling and improved ease of the overall cleaning. Faster post clean rinse down is also achieved, which contributes in waste reduction, and the decrease of the cleaning outage and costs. Note: There is concern in the RO industry with the potential risk of irreversible membrane damage if the isolation cleaning header valve is closed while the RO is in service. With proper operating procedures which includes a return to service check off protocol and locked in service valves this can be eliminated.
Antiscalant Chemistry
The antiscalant chemistry used in pretreating the RO feedwater has been primarily adapted from chemistries utilized in cooling towers and boiler water programs. While there are documented success with the RO antiscalant pretreatment there are also poor success stories. There is no all-purpose antiscalant chemistry that is suitable for pretreating all of the variations of constituents that are present in RO and cooling tower feedwater.
Cooling tower chemistry deals primarily with water recirculating through a cooling tower and heat exchangers which become concentrated via tower evaporation. The limiting factors are typically the materials of construction, the temperature of the surfaces being cooled, constituents in the water used for tower makeup and the chemistry program objectives (e.g. prevention and control of scaling, corrosion and biological activity).
Boiler chemistry deals with bulk boiler water concentrations that are dependent on the operating pressure which can cycle the feed water constituents by 20-100 times, and in areas of high heat flux the concentration of impurities can be very high. As a result, emphasis is placed on quality boiler makeup for removal of undesired constituents and tailored boiler chemistry programs to prevent corrosion and scale formation to maintain boiler cleanliness.
While there have been significant efforts made by industry to tailor RO pretreatment chemistry over the past few years. We have had limited success in evaluations done with six different antiscalant and dispersant chemistries which has led us to try switching out the acid used for adjusting the feedwater pH.
The present pretreatment chemical being used is a blend of phosphonates and dispersants which helps to control barium, calcium, magnesium, silica and strontium sulfate scaling. However, the effectiveness of the dispersants is significantly reduced when the feedwater pH is lowered as presently done to control aluminum scaling. The decision then must be made which scalant does one want to deal with and its subsequent consequences?
Normally, the approach would be to increase the dosage rate of the pretreatment chemical to compensate for the loss in dispersant effectiveness. However, increasing the dosage rate also increases the amount of phosphonates which can lead to calcium, magnesium, and silica interactions that could result in membrane scaling.
Antiscalant Injection
During the July 6, 1994 RO Cleaning, laboratory personnel noted high turbidity in the first pass cleaning solution (normally turbidity and debris are noted only in the second pass cleaning e.g. barium deposition). Analyses of the cleaning skid and strontium, reference deposit analyses in figure 8. A potential problem with injection being in front of the cartridge filters. The dispersant could disperse the trapped debris from the cartridge filter into the first pass elements which can result in plugging of the feed channel spacers. To eliminate this problem, the injection line was relocated to inject downstream of the cartridge filter.
Brine Reject Fouling Monitor
In an effort to appropriately address what is occurring with the brine chemistry, a membrane fouling monitor utilizing a 2.5 inch x 2.5 inch scavenger element was built. The objective of the fouling monitor is to evaluate various dosage rates of the antiscalant being used, based on using the RO brine reject as the feed to the fouling monitor, reference figure 9.
Due to the scaling being accumulative over several months and that the NORMPRO membrane normalization program was noting the same trend, this effort was later discontinued. However, analysis from the membrane biopsy confirmed high barium, strontium scale constituents were present. These results also correlated with what was found in the biopsies of the last stage elements removed from the second pass, reference scale analysis in figure 10.
After change over to the hydrochloric acid pretreatment (discussed in next section), the fouling monitor will be used as a long term monitoring device (e.g. the approach is similar to the use of corrosion coupons to measure the corrosion rates in the cooling tower chemistry program). Whenever the RO Train A, second pass is cleaned, the scavenger element will be removed and cut open to analyze the constituents present in the membrane (NOTE: With the scavenger element cost @ $25-50, it is much cheaper to cut open than a last stage element @ ~$1,250). The analyses will be used to trend the constituents in the back end elements of the second pass. If the barium scaling can be mitigated, the trending of scale constituents would be useful in determining other long term limitations or refinements of the pretreatment chemistry program (e.g. antiscalant, dispersant, hydrochloric acid, RO system recovery rate, pH control point).
Acid Pretreatment Change to Hydrochloric From Sulfuric Acid
Due to the difficulty of removing barium and to lesser extent strontium sulfate scalants during the second pass membrane cleanings, additional measures were required to restore the RO performance back within specifications. To date there have been two options taken to restore the RO system back to original specifications:
1) Chemical clean the second pass, then remove of the back two elements (reference elements # 3 and #4 in figure 4) from the second pass vessels (total of 4 elements). The membranes that are removed are sent out to have them individually cleaned by a vendor to remove barium deposition. NOTE: the vendor utilizes a single element vessel to clean the membrane element with various cleaners element using forward and reverse cleaning flows in order to restore the membrane performance back within specifications.
2) Rotate the Train A second pass last stage elements with the Train B second pass last elements once every two months. The Train B unit with its feedwater being the RO product from the Train A unit will flush out the barium in approximately 7 days. The cost per two month rotation is $346 (requires ~16 man hours plus replacement o-rings/grease). The rotation approach could lower the annual membrane cleaning requirement to approximately 3 per year and eliminate the need for option #1, of sending out the membranes for further individual cleaning. NOTE: Due to the increased handling which could induce problems in Train A or B and quickly erode any potential savings, the preferred option is #1.
Unless a new chemistry specifically for barium scaling is developed, the remaining options are to lower the RO system recovery or to replace the sulfuric acid pretreatment with hydrochloric acid. Lowering the RO system recovery significantly increases the overall cost to produce RO product it would not be considered unless it was absolutely necessary.
Using hydrochloric acid reduces the amount of sulfates available in the brine concentrate, which helps to lower the potential for barium sulfate formation. Based on the computer projections, with hydrochloric acid feed the barium sulfate saturation at the membrane surface lowers to 38 versus 54 times saturation with sulfuric acid. With the scaling problem at the last stage element, the changeover to hydrochloric acid and its reduction of 30% in barium sulfate formation may reduce the scaling rate or potentially eliminate the scale formation problem.
Due to the differences in price between the 36% sulfuric acid and 31% hydrochloric acid an increase the pretreatment operating costs @ 50% operating capacity is $1,782 and at 100% capacity is $3,653. NOTE: 36% sulfuric acid is used in lieu of the cheaper 93% sulfuric acid for the safety of plant personnel. A vendor visits the plant as required to top off the 500 gallon storage tank without requiring the need for plant personnel. Better pH control is also achieved with the diluted 36% versus the concentrated 93% sulfuric acid. Good pH control is also expected with the 31% hydrochloric acid.
If the changeover to hydrochloric acid is successful in reducing or eliminating the barium scale formation, the membrane cleaning frequency could potentially be reduced to less than 2 times a year. In addition, the required membrane rotation/restoration could be eliminated for an annual savings of $3,483 (based on 3.5 cleanings a year). The combination of these two benefits could potentially reduce the annual overall membrane cleaning costs by ~$5,800. Based on the present 50% operating capacity factor the total savings in membrane cleanings versus the increase in acid cost of $1,782 for pretreatment should result in an annual savings of ~$4,000. The estimated cost for changeover to hydrochloric acid is $955 and is expected to take place by November 1994.
Summary
When we first started investigating why the RO unit was performing poorly, it quickly became apparent that the primary problem was membrane scaling in the first pass. After extensive analyses it was determined that the major scalant was aluminum. There were three options available for reducing the aluminum scalant, (1) upgrade the prefiltering system to trap out aluminum, (2) install water softeners and pretreat by softening the feedwater, (3) lower the feed pH after the primary filters to keep the aluminum in solution and discharge it in the RO brine reject. We opted for the 3rd option due to the ease of implementation and economics. We were successful in changing the interval between membrane cleanings from 5 weeks to approximately 3-5 months.
With the aluminum scaling under control the next problem to develop was barium scale problems in the second pass elements. To date a number of measures have been employed to reduce the impact of barium scalant. The easiest have been evaluations of various antiscalants and antiscalant/dispersant formulations. Overall the best (although limited) success has been with the combination of antiscalant/dispersant. However, coupled with the reduction in sulfate with the changeover to hydrochloric acid for adjusting the feedwater pH, the reduction in barium sulfate saturation may be enough to exit the second pass last stage elements to either eliminate or increase the interval between membrane cleanings associated with the barium scaling.
Even though the vendor is typically the expert in the field, end users need to be actively involved in the original bid specifications. Our experience has taught us that the minimum considerations and requirements for RO system operation are as follows:
- The minimum acceptable criteria (e.g. 92-98% removal of the feedwater constituents, desired gallonage rate) should be designed around the worst case water constituents and lowest feed temperature.
- To have better system flexibility and reliability, the system should consist of a minimum of two “50-70%” of a desired product flow RO units. If problems with one of the RO units e.g. pump failure, down for membrane cleaning, the plant still has the ability to produce RO product for makeup.
- Each RO system should have, 1) post shut down brine flush that bypasses the brine control valve while flushing is taking place (RO product water provides the best result and if city water is used the pH and chlorine should be maintained within normal service specifications), 2) acid, antiscalant and chlorine chemical injection, 3) inter-stage pressure indication, 4) adequately designed primary and secondary cartridge filters.
- The inter-stage header between the array stages should have isolation valves for use during chemical cleanings. This helps to prevent cross contamination of the cleaning solutions from compromising the pass that isn’t being cleaned.
- Flow rate during membrane cleaning needs to supply sufficient velocity across the brine channel mesh spacer between the membrane sheets to prevent the potential for scaling and plugging of the brine feed channel during the cleaning. If the velocity is too low, precipitation can occur which becomes the seed for further scale formation of coagulated colloidal particles, increasing the pressure drop across the membranes and the subsequent requirement for more cleanings.
- At the time of purchase a used RO system, the unit should be re-membraned with new membranes as originally specified (as a minimum) in the contract. The seller should also provide membrane element serial numbers with the date of manufacture, performance guarantees and a drawing showing the exact location of each membrane element.
- If the RO operator is a vendor, they should provide the end user with data on the performance (e.g. pressure, conductivity, system flow rates, pH) of the RO system and provide a weekly report. The reports should use an agreed upon software normalization program to determine membrane performance (e.g. Fluid Systems NORMPRO). The normalization program should be based on ASTM-D4516, Standard Practice for Standardizing Reverse Osmosis Performance Data, Annual Books of ASTM Standards, Water and Environmental Technology, Section 11. These reports will provide documentation on how the RO system is operating and be useful towards making any decisions on purchasing or continuing to have vendor operate the RO system. This same criteria applies to the end user if they are the operator of the OR system. The percent rejection criteria e.g. 92%, should be based on the feed water constituents before any pretreatment chemical additions. This prevents the end user from being penalized by overfeeding of treatment chemicals.
- Organic fouling has been noted during membrane inspection that is related to the system being exposed to sunlight. A roof was erected to the RO system during 1993. Subsequent second pass membrane rotations have noted a significant drop in the amount of algae present on the elements since the roof was erected. The roof over the RO pad helped to prevent ultraviolet ray deterioration of the PVC piping and protect process monitoring instrumentation from the elements.
- A potential problem with the dispersant pretreatment chemistry is with the chemical injection being in front of the cartridge filters. The dispersant could disperse the trapped debris from the cartridge filter into the first pass elements which can result in plugging of the feed channel spacers. To eliminate this problem the injection line should be located to inject downstream of the cartridge filter.
- To reduce the adsorption rate of carbon dioxide back into the RO product (which increases the loading on the anion exchange resins), RO product should be fed directly to the demineralizer, or if routed to a product storage tank, employ a floating roof or nitrogen cap system.
- With the significant change in the silica percentage due to its removal by the RO, an evaluation between strong base Type I and Type II resins should be done. In most cases the option to use Type II anion resin will significantly increase the overall DI service run gallonage. The same is also true with RO pretreatment that the DI cation regeneration could replace the two step with a single step acid regeneration.
- The method used for deposit analyses encountered problems for accurately determining the true amount of barium being present and a new method was utilized. The new procedure used is the flux method, which requires drying, ashing, and solubilizing of solid wastes using lithium metaborate (Libo2), fusion is used for the determination of inorganic constituents by inductively coupled plasma – atomic emission spectrometric (ICP) or by atomic absorption (AA).
This method, ASTM method “Standard Practice for Dissolution of Solid Waste by Lithium Metaborate Fusion”, is intended for the solubilization of nonvolatile inorganic constituents, particularly barium, in solid waste. The fusion method is also appropriate for analyses of the silicate matrix. This procedure was used in the laboratory when classical dissolution methods, SW-846, failed to obtain the estimated sample concentrations of barium.
Acknowledgement
I would like to acknowledge the tremendous effort of the Encina Power Plant maintenance, operation and engineering staff and specifically two plant laboratory personnel, Tom McCluskey and Pedro Lopez.